
How to Talk to a Climate Denier
Hi friends! I often talk about how much my meditation practice affects my entire life but at no time do I need it more than when someone questions the validity of ‘Climate Change’. Seriously! I’m sure I’m not the only one who needs to take a deep breath and look very hard to see that the other person is me (thank you Yogi Bhajan). I try not to get too down on myself that I don’t ever have the presence or the guts to respond with the perfect comeback, because that rarely elevates anyone anyway.
Recently, I had the perfect opportunity to respond to someone who emailed me a ‘climate denier’ video, and requested an email back to refute it. It was like a dream to have time to compose myself and my thoughts and really edit a focused response. It was so satisfying that I thought I should share it!
The next time the climate denier in your life trots out some of the standard BS, try this method for crafting a response.
First, give yourself an idea of where they are getting their information. Ask for some websites that support their viewpoint (believe me, there are MANY. And anyone who is still going against popular science, has probably researched it and they will have some addresses).
Take their list of crazy to https://mediabiasfactcheck.com/ a website with very clear perspective and a long list of ties to entities that it rates both ‘right’ and ‘left.’ It seems very objective, and it also evaluates the website-in-question's historical accuracy and sourcing, giving a ’truthfulness’ score from 1-100 and any other information it has found about its writers’ qualifications.
Based on this, you will be able to prepare yourself for the snide sarcasm (my friend’s video referred to us as ‘climate alarmists’ and of course made a dig about Greta Thunberg’s age). Ignore that and start looking for the DATA. Jot down any specific figures that you are surprised by, as well as the general area they are taking about (there are SO many elements in the climate crisis: rising temperatures, ice melting, seas rising, extreme weather…). Your discussion will be most effective if you can directly rebut ‘alternative facts.’ Pick out some stuff and use the internet for its most meaningful use!
Then, it’s time to start googling! I started at the most useful website for science lovers: scholar.google.com it is exclusively for scholarly publications (and there is also a law library). You can read the abstracts for free and get a lot of info from them or get led to interesting, reputable sources. I’ll keep my fingers crossed for you that you’re not in a debate with a maniac who is outspokenly against science.
I decided to look up historical temperatures (this video said that global temperatures before 1960 do not support the theory that temperatures are rising dramatically), melting glaciers, and loss of sea ice. Those were the main points in the video I saw.
Historical Temperature: This video said that the climate activists don’t use data from before 1960. I don’t know why because I found this NASA/NOAA website
https://data.giss.nasa.gov/gistemp/
It has a really cool map generator where you can pick the dates and different figures, and they have all kinds of graphs too. Here’s a pretty clear graph showing overall warming, all year long, since 1880:
And I made this Map for August temperature anomaly from 1880-2000. Also pretty clear that most of the planet especially the icy part, is getting overall hotter.

OK so that is one major point refuted, but there was lots of information about the rising temperatures.
This graph is from a different NASA site and it covers the missing dates my video cited but shows a clear trend as well.
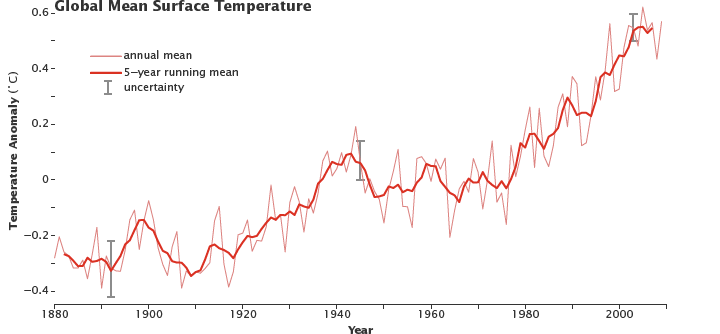
Despite ups and downs from year to year, global average surface temperature is rising. By the beginning of the 21st century, Earth’s temperature was roughly 0.5 degrees Celsius above the long-term (1951–1980) average. (NASA figure adapted from Goddard Institute for Space Studies Surface Temperature Analysis.)
In looking for data about melting glaciers, I could not find much info about this because mostly it comes from satellite photography that has not been around so long. However, I did find this survey of Alpine glaciers that goes back pretty far-they clearly had their heyday in the 60s. But it’s true that before that they were not much larger than they are now.

from Wikipedia
Not a super-powerful response, I agree but now I’m going to make one point about this discussion: Try not to make your points with a superior attitude-come at it from a point of curiosity and learning. It is important to leave space for your friend who is not where you are. Admitting that you are not 100% right is always a good start because nobody ever is!
Then, you can appeal to their sense beauty: On this continent there’s even less info but here is an attractive photograph of Glacier National Park…

Large moraines at the base of Logan Glacier (2016) mark the extent of the glacier before it began its retreat around 1850 AD.(Public domain.)
Nice until you realize that the band of snow there used to be attached to something you can barely see any more. I am not sure where they got this figure of it beginning to melt in 1850 but since the site was from NASA I consider it reliable.
Sea Ice: again it’s hard to find info because it is mostly based on satellite photography. We all know that there is a problem up there, it does not take a scientist to know that when the temperatures are rising the most where the ice is (see map above), then the ice is going to melt. But we are looking for data and scientific study, not just going on logic here (not my favorite way to be but sometimes you have to).
I did find this very interesting bit about the Greenland Ice Sheet, which seems to be a good single representative for sea ice. it explains how they estimated the measurements starting in 1900 (and really all of the data is estimates)
https://www.nature.com/articles/nature16183
It looks like it’s by a bunch of Danish scientists, published in the very reputable science journal Nature. Certainly a reputable source among Earth scientists.
Here’s the clincher from that article:
We estimate the total ice mass loss and its spatial distribution for three periods:
1900–1983 (75.1 ± 29.4 gigatonnes per year),
1983–2003 (73.8 ± 40.5 gigatonnes per year),
2003–2010 (186.4 ± 18.9 gigatonnes per year)
WOW! From 2003-2010, in only 7 years, we lost more than 2x the amount of ice lost in the first 83 years of the Industrial Age.
SO, there are three pieces of scientific data that support the theory of climate change. The thing about all of these independent measurements is that they are all happening together and the combined effect can barely be understood by anyone. And the fact is, science cant really 'prove’ anything-that's not how science works. It makes observations and measurements that can be interpreted in many different ways. I feel that it is important to get as much information as possible and rely on expert evaluation to understand it-It is especially helpful to look for stories written about the article
Other helpful information is anything that is in the news this week (there’s always more)! At the time of my writing it’s this:
Last week, the IPCC released their report specifically on global water, or at least the Oceans and Glaciers. The IPCC is often dismissed by the right-wing because of its home-the UN-but outside of politics, it's considered an authority on climate research, comprising over 100 scientists from 39 countries. You can read a good review of the report here on the international news wire site from Reuters:
The most prominent data is: if current trends continue, in the next 60 years 80% of the glaciers that provide water to 670 million people will be gone. It also touches on melting permafrost around the globe as well as the rising temperature of the oceans.
Finally, I will leave you with this video https://youtu.be/63hAHbkzJG4
It is the video I tell most people to watch about climate change (it does not make me cry like the Greta videos do). It is very interesting and encouraging- it explains why it is that specifically fossil fuels are the problem and we can continue to have and do everything as long as we find alternative sources for fuel and plastic -there are lots! I honestly do not think this is a political video- just scientific. At a bit under 20 minutes, it is worth it to really understand the biological carbon cycle, and why it’s at the center of the climate crisis. I learned a lot and really improved my outlook on our future beyond the year 2030.
The best news is that my friend really liked the video too. In fact, they said they would be forwarding it to their own friends—what a victory to expand the awareness of the actual mechanics of the problem!
My wish, as with everything that I’m doing, is that I can help others gain the awareness that shines light on our current state of disharmony with our planet. By practicing the experience of the elements of nature, we can connect to all and understand that we are all.
xoxox
xty